Building charts and diagrams using Mermaid
An easy way to concept your complex thoughts and ideas, or provide an overview over your data and data structures.
Do you sometimes feel like your ideas are too complex to wrap your head around them without some form of illustration to structure them? Or do you sometimes experience that your colleagues struggle to follow the logic of your complex project code if you do not provide them a visualization aid?
Then Mermaid might be just the tool for you!
What is mermaid?
Mermaid is a popular open-source tool that allows you to create and publish beautiful, interactive diagrams and charts. It is particularly well-suited for creating diagrams that represent data, such as flowcharts, sequence diagrams, and class diagrams.
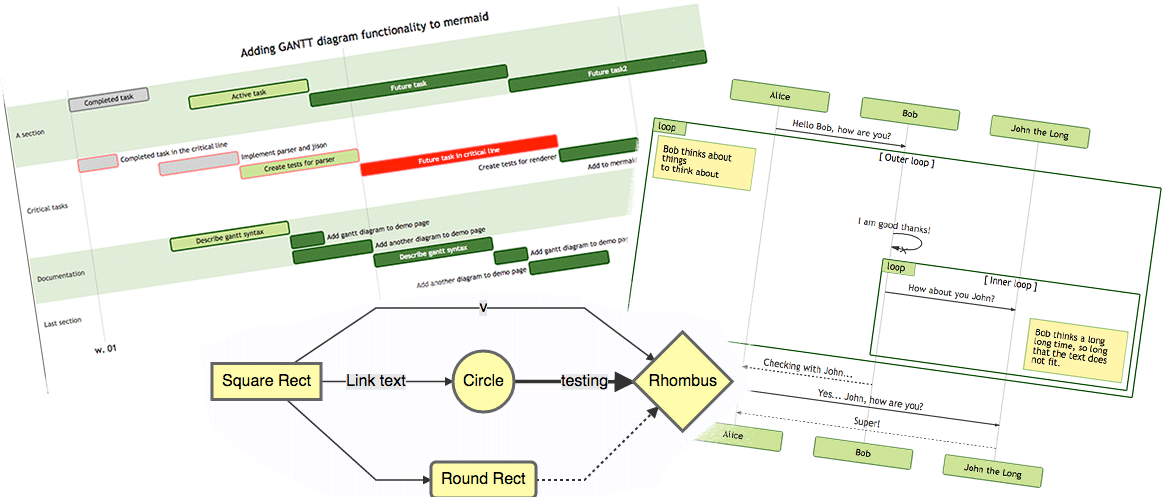
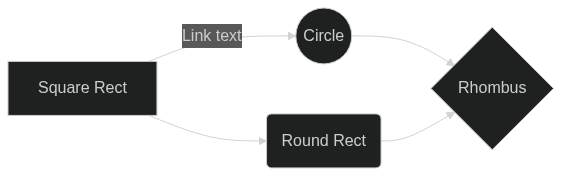
One of the great things about Mermaid is that it is easy to use and learn. To create a diagram, you simply write text using the Mermaid syntax, and then use the Mermaid library to render the diagram in your web page or document. For example, here is how you would use Mermaid to create a flowchart:
graph LR
    A[Square Rect] -- Link text --> B((Circle))
    A --> C(Round Rect)
    B --> D{Rhombus}
C --> DThis code would produce a flowchart with four shapes connected by arrows, like this:
Mermaid also supports a wide range of customization options, so you can create diagrams that match your own style and branding. For example, you can change the colors and fonts of the shapes and arrows, add labels and annotations, and even use custom shapes and images.
In addition to creating static diagrams, you can also use Mermaid to create interactive diagrams that allow users to explore and interact with your data. For example, you can create diagrams that allow users to hover over or click on elements to see more information, or diagrams that allow users to filter or sort the data in different ways. To really make a diagram your own you can even add Javascript, HTML and/or CSS code.
To obtain a Mermaid graph, you simply copy and paste the above code into Mermaid's Live Editor. The editor does not only allow you to immediately see the effects of your (changes in the) code but also to export them as image for storage or sharing. It also provides you a link for re-rendering it directly in the internet such that you can simply share the link to anybody.
What use does it have for software developers or data scientists?
When you are a developer or data scientist, you sometimes find yourself in the need to share complex code. For example, when you wrote object-oriented programming program that contains a lot of classes, it can often be tremendously helpful to share a visualization of how these classes are functionally connected. In comes the class diagram. A class diagram is a visual representation of the classes in a system, their attributes and methods, and their relationships with each other.
Here is an example of how to write a class diagram using Mermaid:
classDiagram

class User {
    - name: string
    - email: string
    - password: string
    + register()
    + login()
    + logout()
}

class Post {
    - title: string
    - content: string
    - author: User
    + publish()
}

class Comment {
    - content: string
    - author: User
    - post: Post
    + submit()
}

User --> Post: creates
User --> Comment: creates
Post --> Comment: hasIn this example, we have defined three classes: User, Post, and Comment. The User class has three attributes (name, email, and password) and three methods (register, login, and logout). The Post class has two attributes (title and content) and one method (publish). The Comment class has two attributes (content and author) and one method (submit).
We have also defined several relationships between the classes. The User class is related to the Post class, as a user can create a post. The User class is also related to the Comment class, as a user can create a comment. The Post class is related to the Comment class, as a post can have comments.
This is how the class diagram looks when it is rendered in Mermaid:
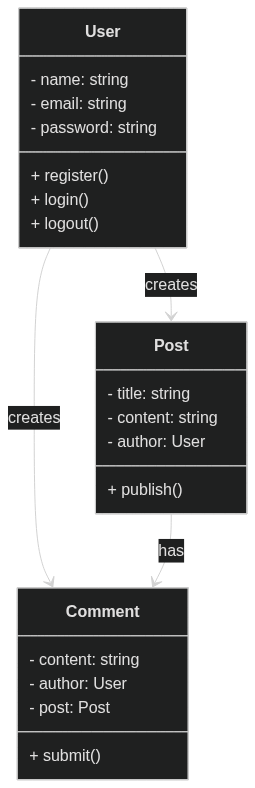
This class diagram provides a high-level overview of the classes in the system and their relationships with each other, and can be useful for understanding the structure and behavior of the system.
Abstract the overall process of your data science projects
Especially as a data scientist, you often need to provide an abstracted version of your approach to analyze the data. This is not only helpful for yourself but also for others working with you on the same project. Other times, providing a general illustration of how data flows from creation or input to the end product of your analysis process is very helpful as a guideline for the process of writing your code or implementing your processes for effectively.
Here is an example of how you could use Mermaid to illustrate the general outline of a data science project:
graph LR
    A[Data Collection] -- Extract --> B(Data Cleaning)
    B -- Transform --> C(Exploratory Data Analysis)
    C -- Visualize --> D(Model Training)
    D -- Evaluate --> E[Model Deployment]
    A -- Store --> F(Data Storage)
    F -- Retrieve --> C
    C -- Analyze --> G[Insights]
This code results in the following diagram:
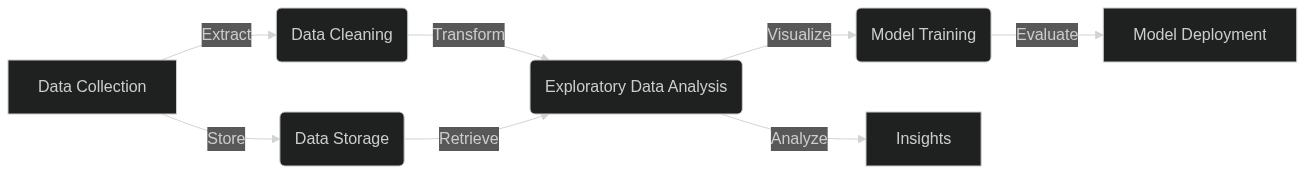
This diagram illustrates the typical steps involved in a data science project, from data collection and cleaning to model training and deployment. The diagram shows that data is collected from various sources, cleaned and transformed to prepare it for analysis, and then stored for later use. The data is then retrieved and analyzed to generate insights, which are visualized and used to train a model. Finally, the model is evaluated and deployed to a production environment.
Such a diagram can be helpful for illustrating the overall process of a data science project, and can be used to communicate the key steps and dependencies involved. It can also be useful for identifying bottlenecks or areas for improvement in the process, and for communicating the value and impact of the project to stakeholders.
In summary
Overall, Mermaid is a powerful and flexible tool that can help you create beautiful and engaging diagrams and charts for your projects. Whether you are creating diagrams to illustrate a process, explain a concept, or explore and analyze data, Mermaid can help you communicate your ideas and insights in a clear and effective way.